 All case studies
Case study · Data infrastructure · Monitoring
Fortified Data
Database Health Monitoring
Fortified’s experts look after other companies’ SQL Server databases around the clock. I designed CoreHealth, the portal where their clients and their own team see the health of an entire data environment, and made the most important things the easiest to see.
- Company
- Fortified Data
- My role
- Principal UX Designer
- Timeline
- 2019–2020
- Worked with
- The CEO, and the CTO and lead engineer
01Context
Every server, every client, one place to look.
Fortified Data is a team of US-based SQL Server experts. Their DBAs monitor, maintain and tune database environments for companies that can’t afford for their data to go down.
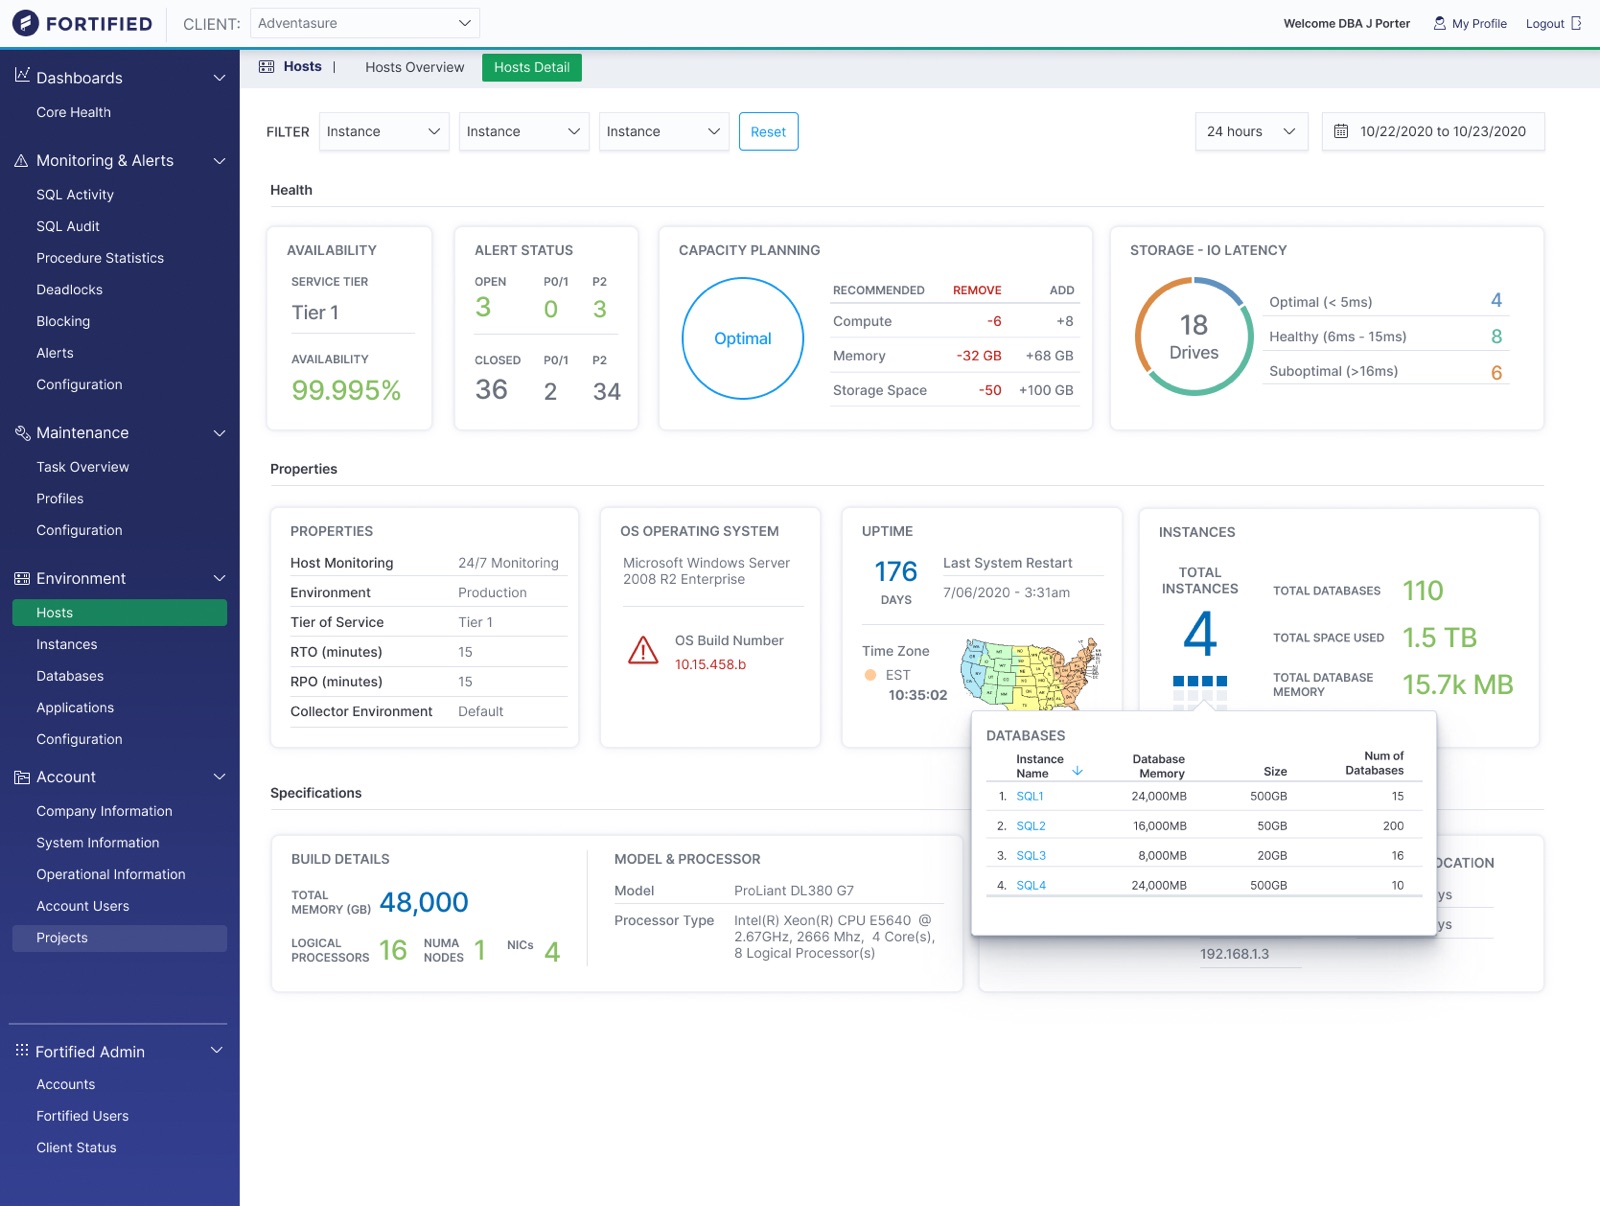
That work produces an enormous amount of information: servers, instances, databases, backups, alerts, tickets, billable hours. CoreHealth was where all of it came together, for Fortified’s admins and for the clients whose environments they ran.
The CEO wanted it to look fresh, clean and informative, and needed a designer to set the vision for his engineering team.
02The problem
Plenty of data. Not enough sense of what mattered.
The challenge:
- Surface the most important things first.
- Provide insight that recommends and prompts action.
- Add beauty and intelligence to very different kinds of data, using distinct charts and graphs to tell them apart.
- Give people both overview screens and ways to dive deeper for more detail.
- Offer different views for different users: an executive view, an admin view and a user view.
03The strategy
Structure first. Then make the data beautiful.
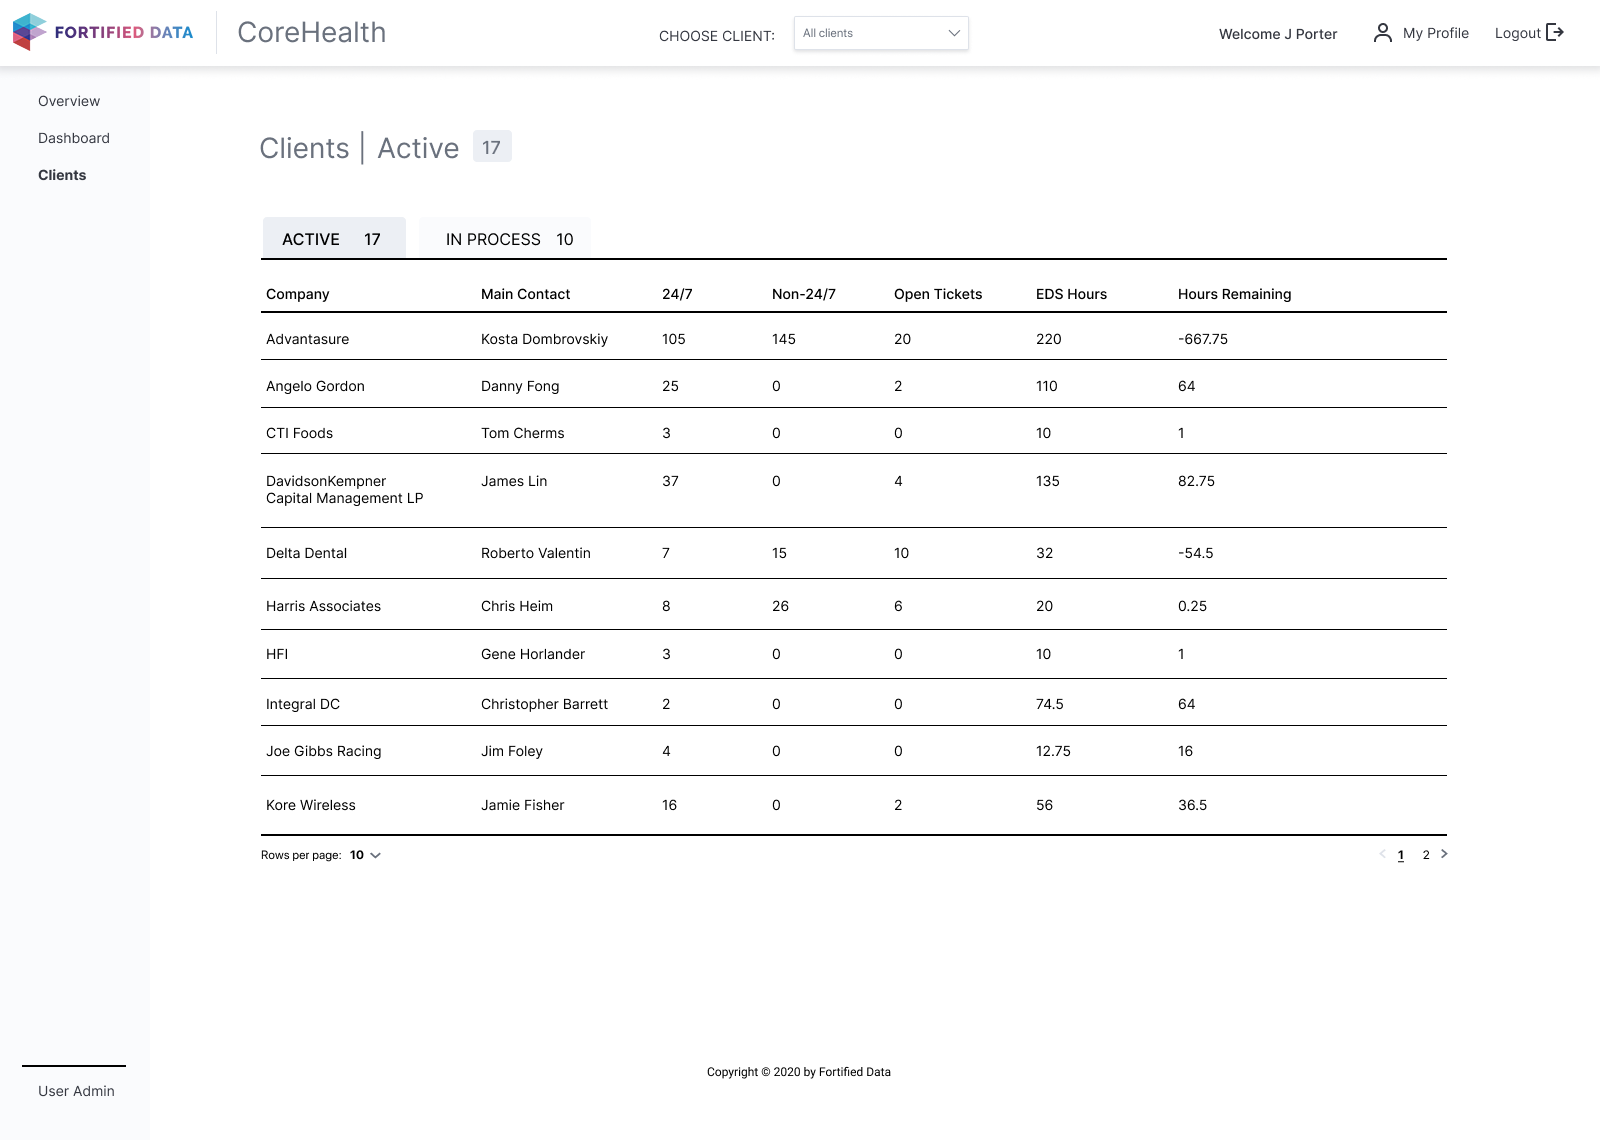
I started with the admin side of the product: managing clients, their systems and their projects. Data visualisation came after those screens were settled.
A simple map of the product’s pieces gave everyone perspective, and mapped who could see and do what across user access and permissions.
04The work
A living picture of an entire data estate.
Wireframes with just enough brand
Simple grayscale wireframes, with a touch of Fortified’s branding, helped the client picture the high-fidelity product to come.
They were also where we worked out whether multi-column forms were useful, and where breaking content up made things simpler to use.
My callPut something close to real in front of the CEO early, so he could react to it while it was still cheap to change.
High fidelity, in layers
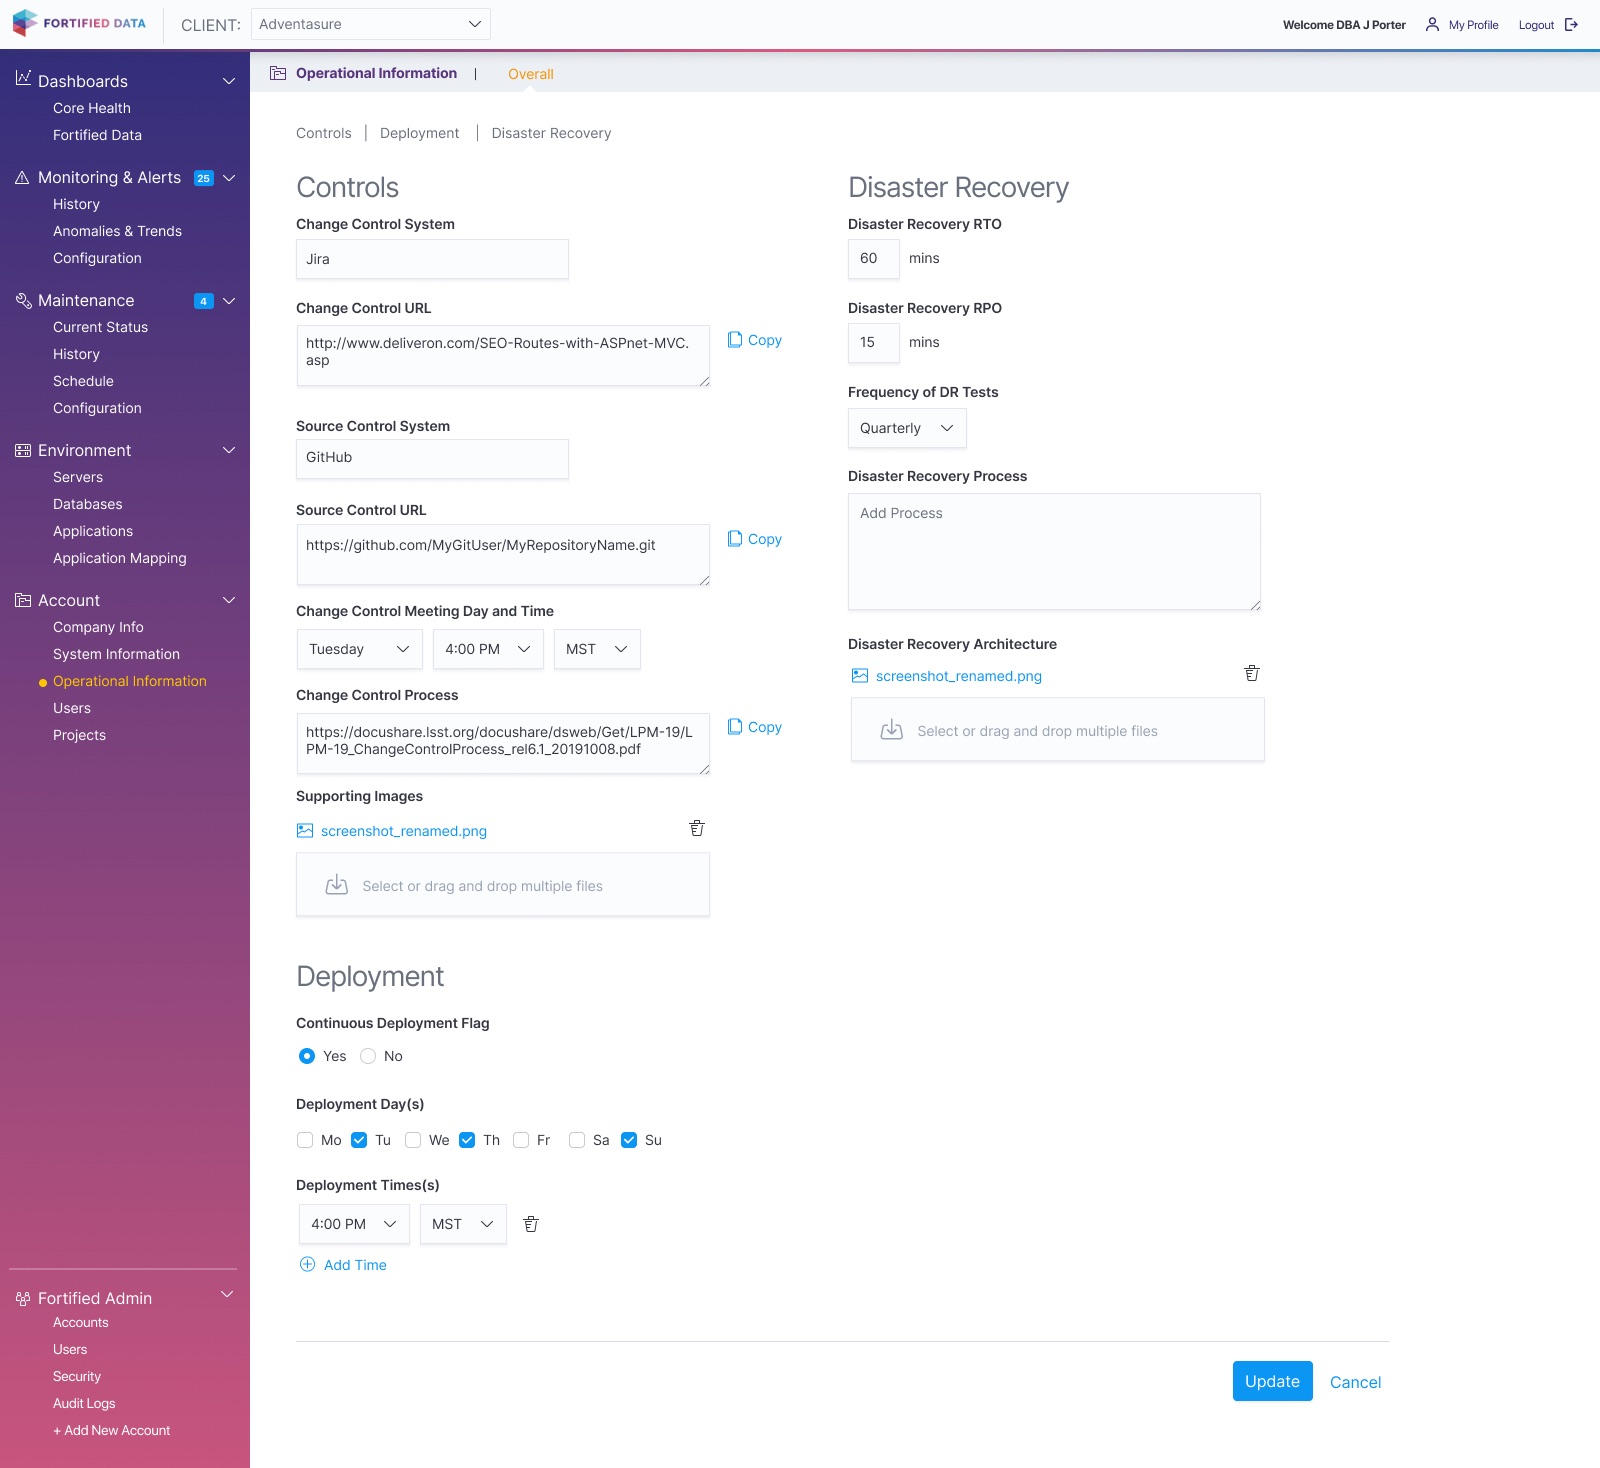
With the wireframes as a guide, I brought in the branding, fonts and components from the component library.
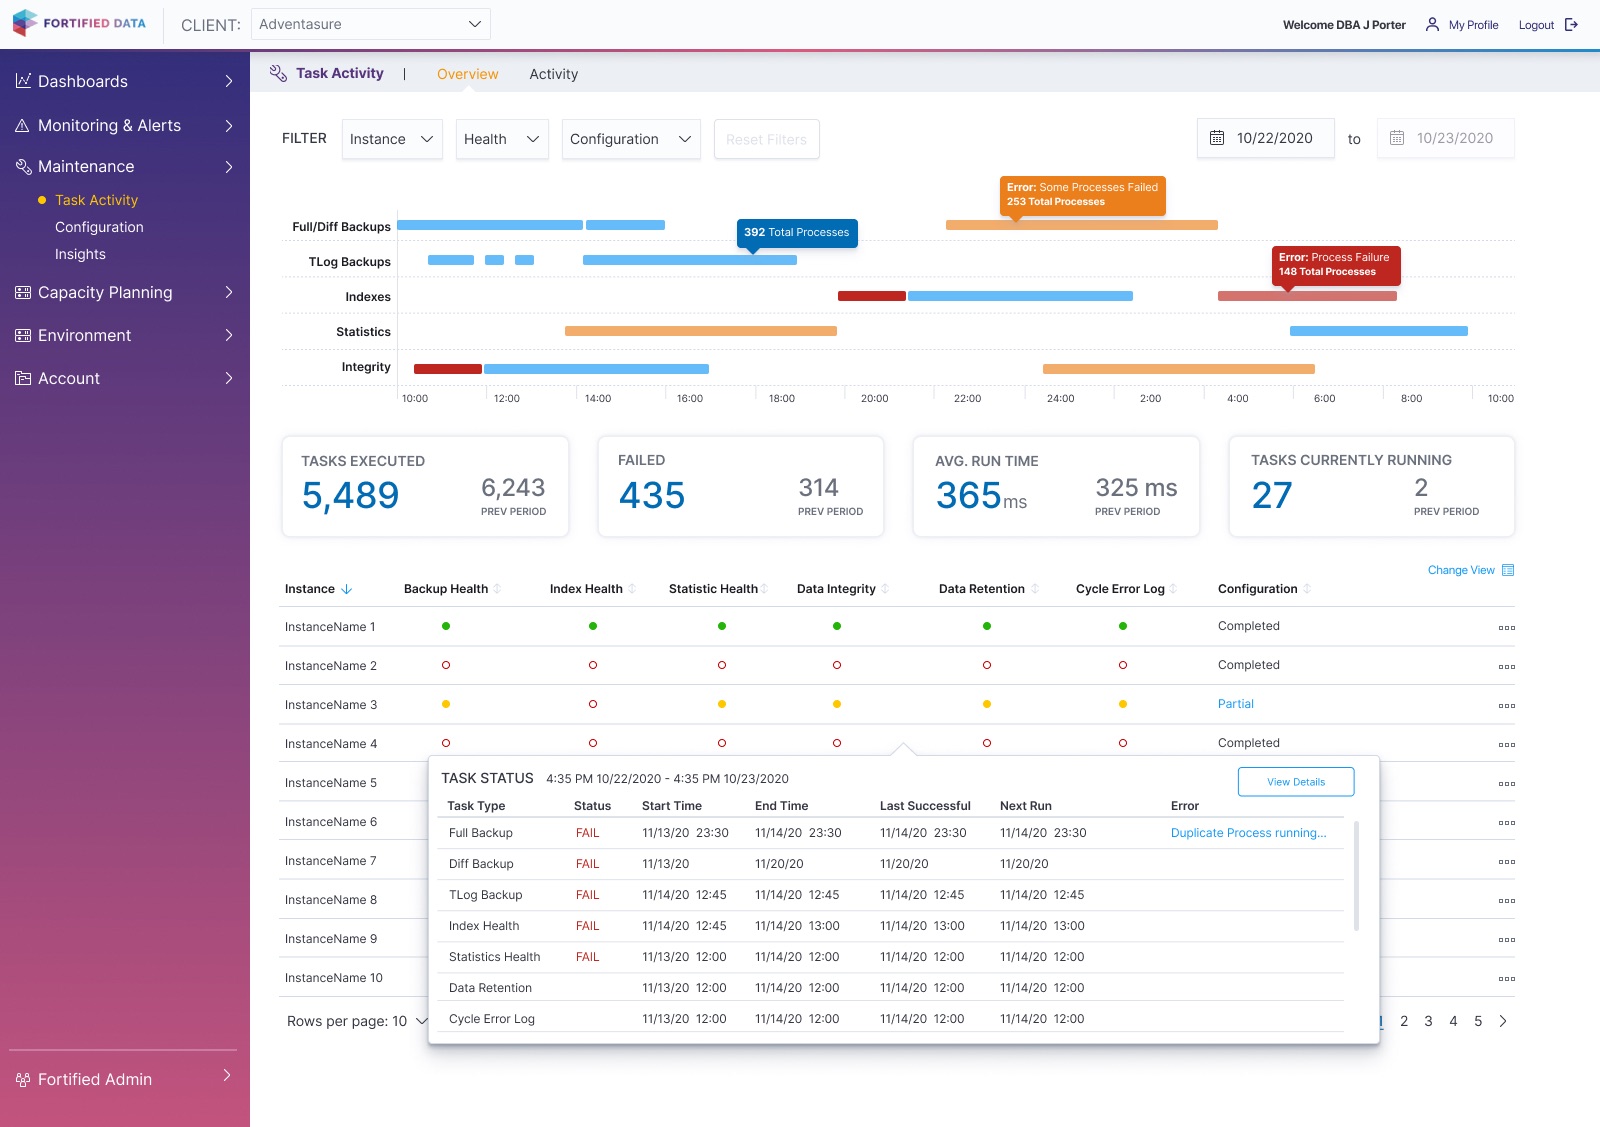
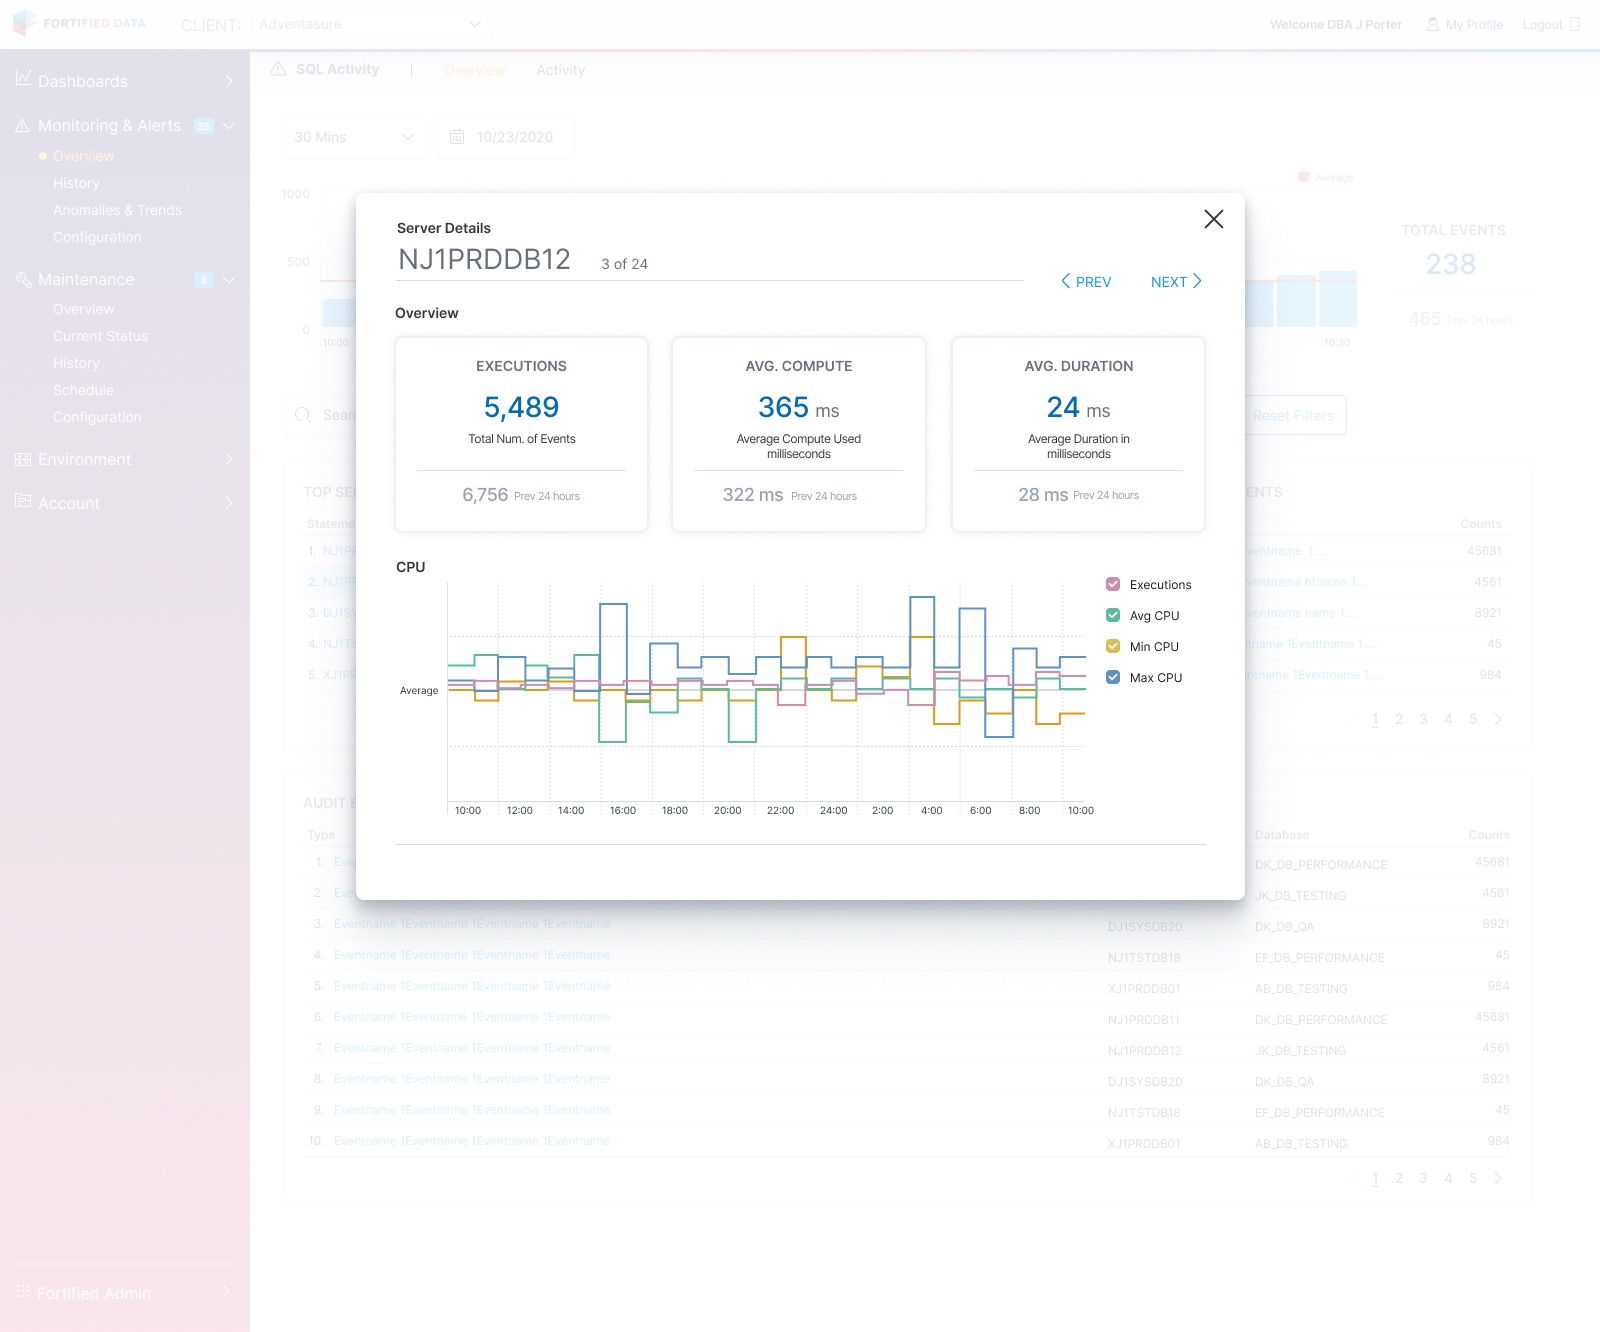
Then I evolved the product’s dimensional layers: navigation, flyovers, popovers, hovers and modals. The overview stays put while the detail comes to you.
My callBuilt every screen from the component library rather than one-off parts, so what I designed was what got built.
A brand shift, and the data viz grows up
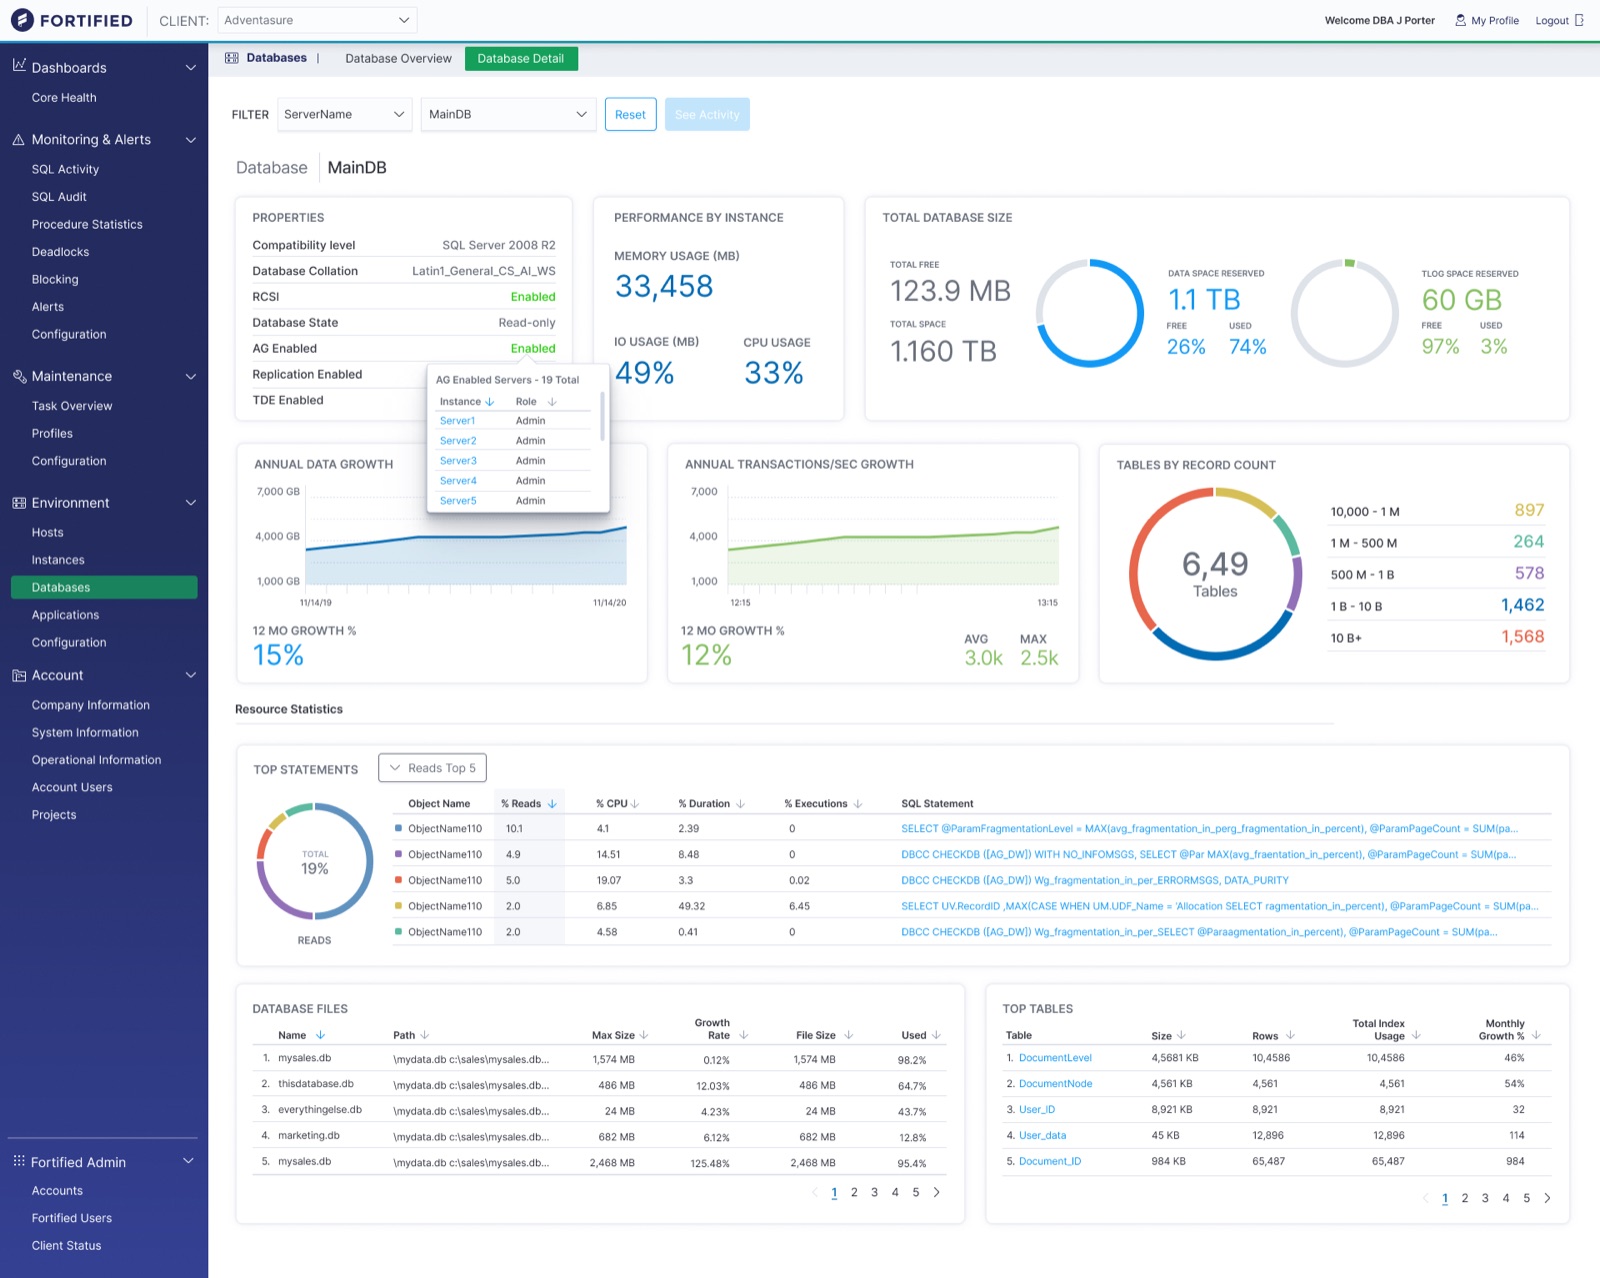
Midway through, Fortified changed its brand. The product took on the new colour palette, logo and icon.
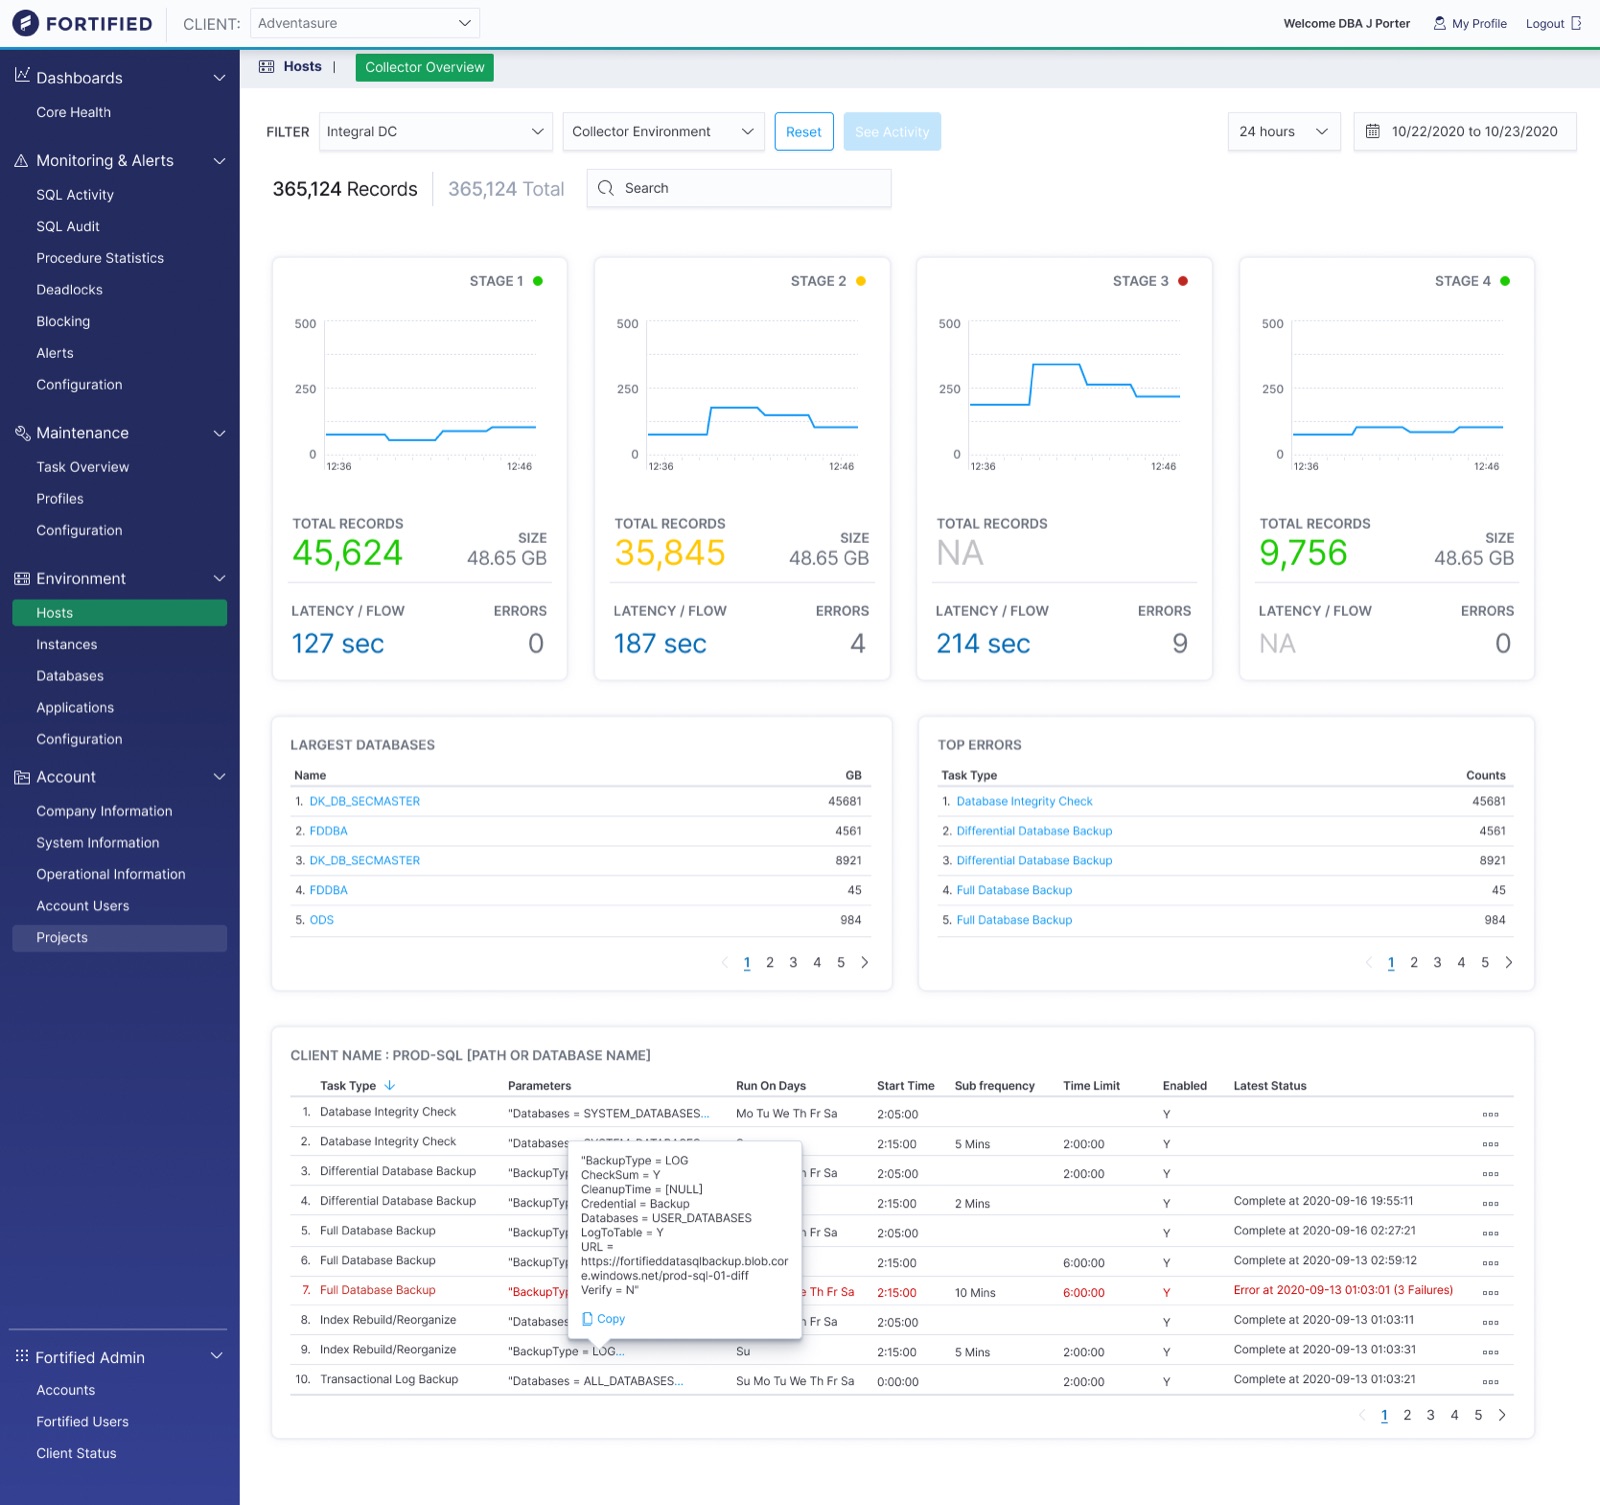
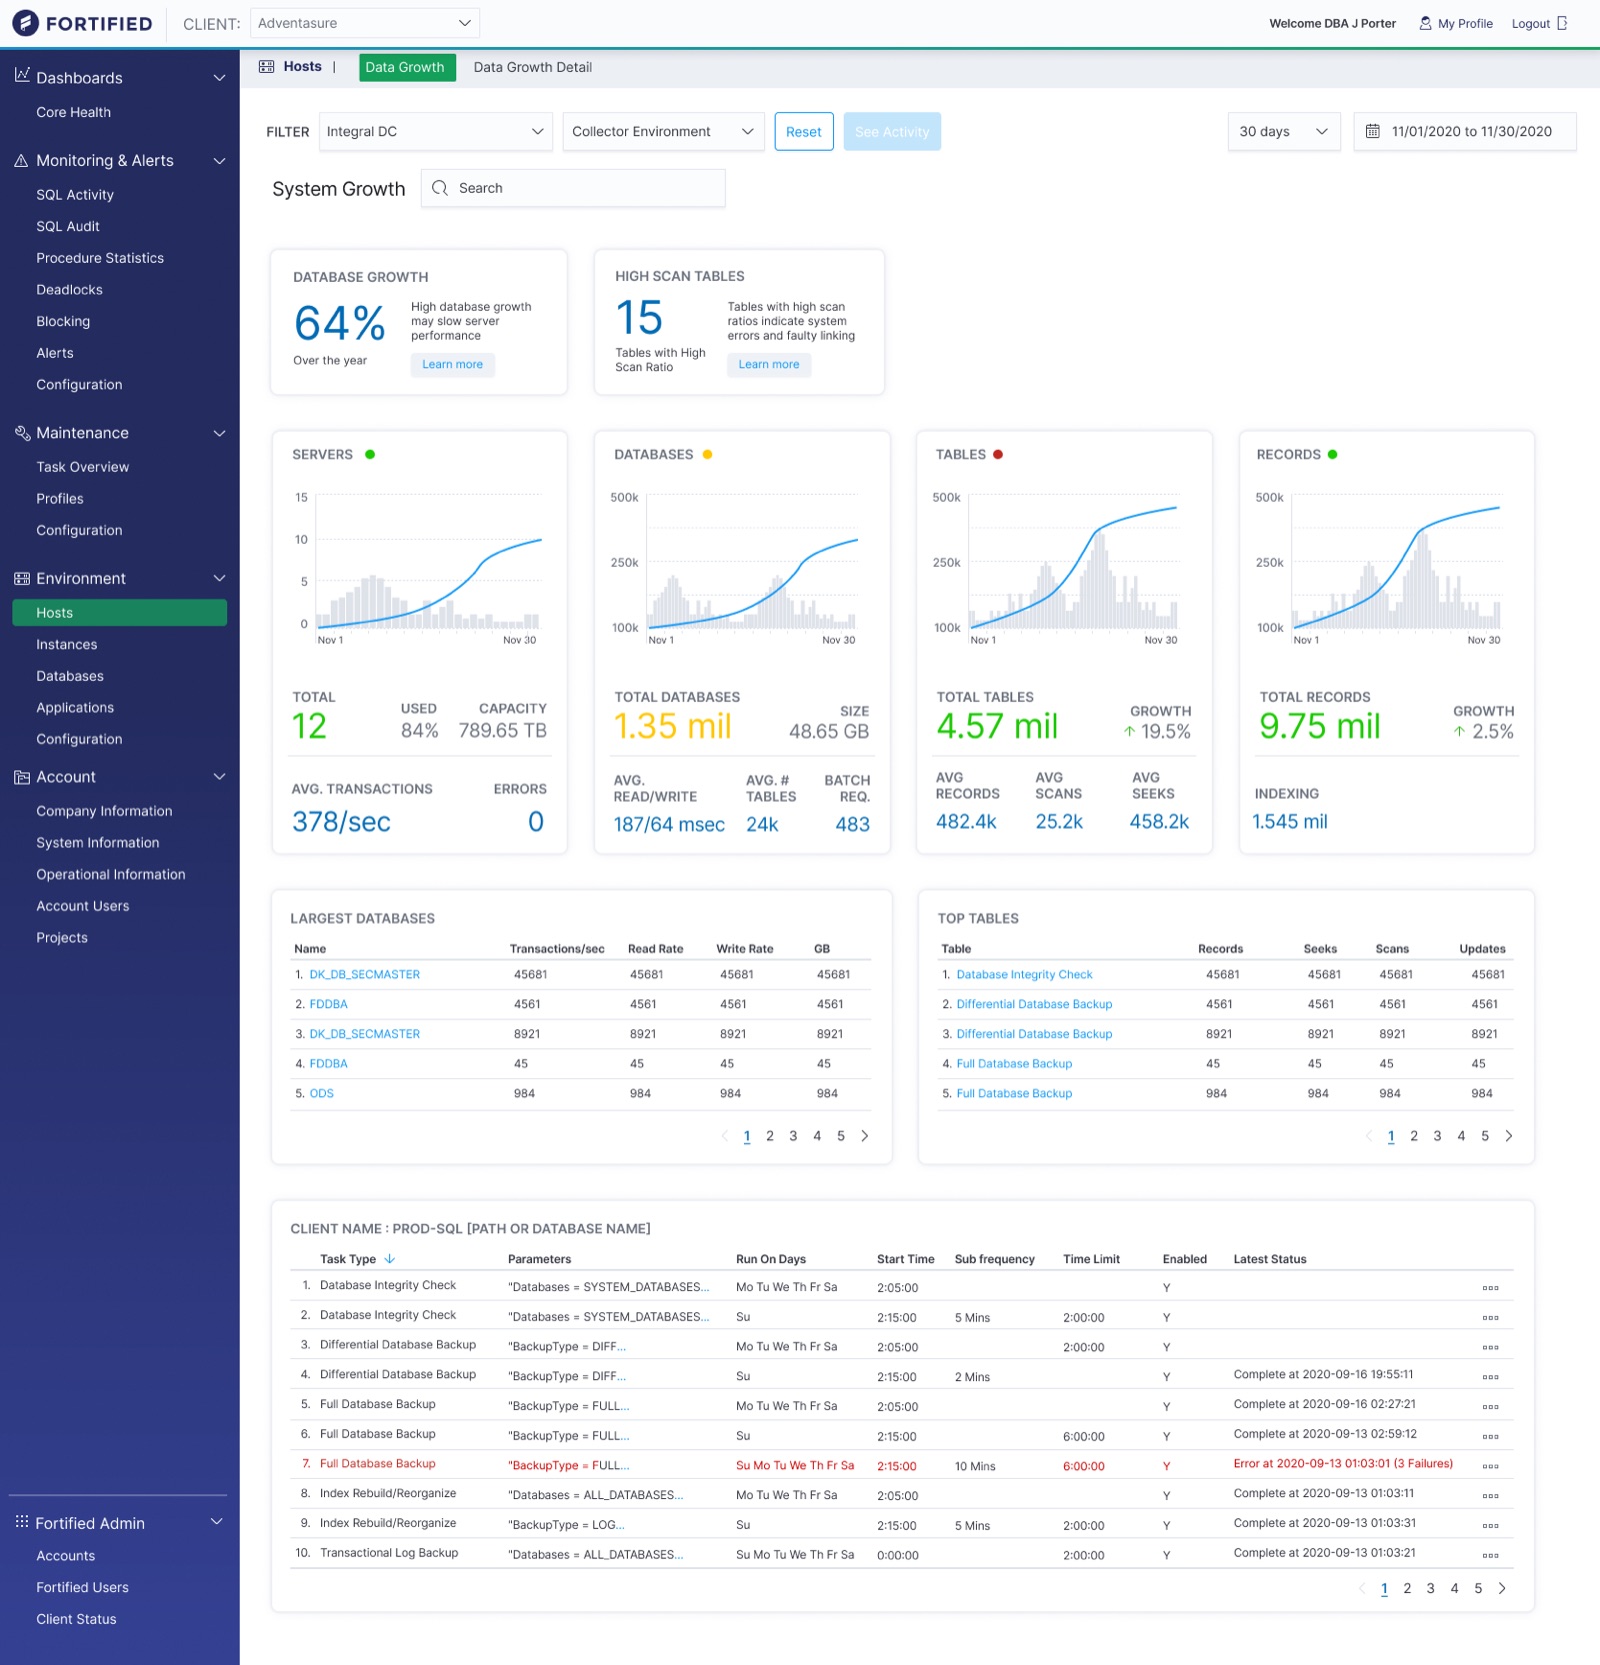
At the same time the data visualisations kept evolving. Size and hierarchy put the alerts and patterns up front; distinct charts for distinct data made each kind easy to tell apart.
My callFolded the rebrand in without stopping the work, and used it to sharpen the hierarchy.
Responsive design and developer hand-off
Using the breakpoints in the design system, I gave developers guidance for every screen size, from 1920 pixels wide down to 575.
My callDesigned every screen inside the design system, so hand-off was guidance rather than a rebuild.
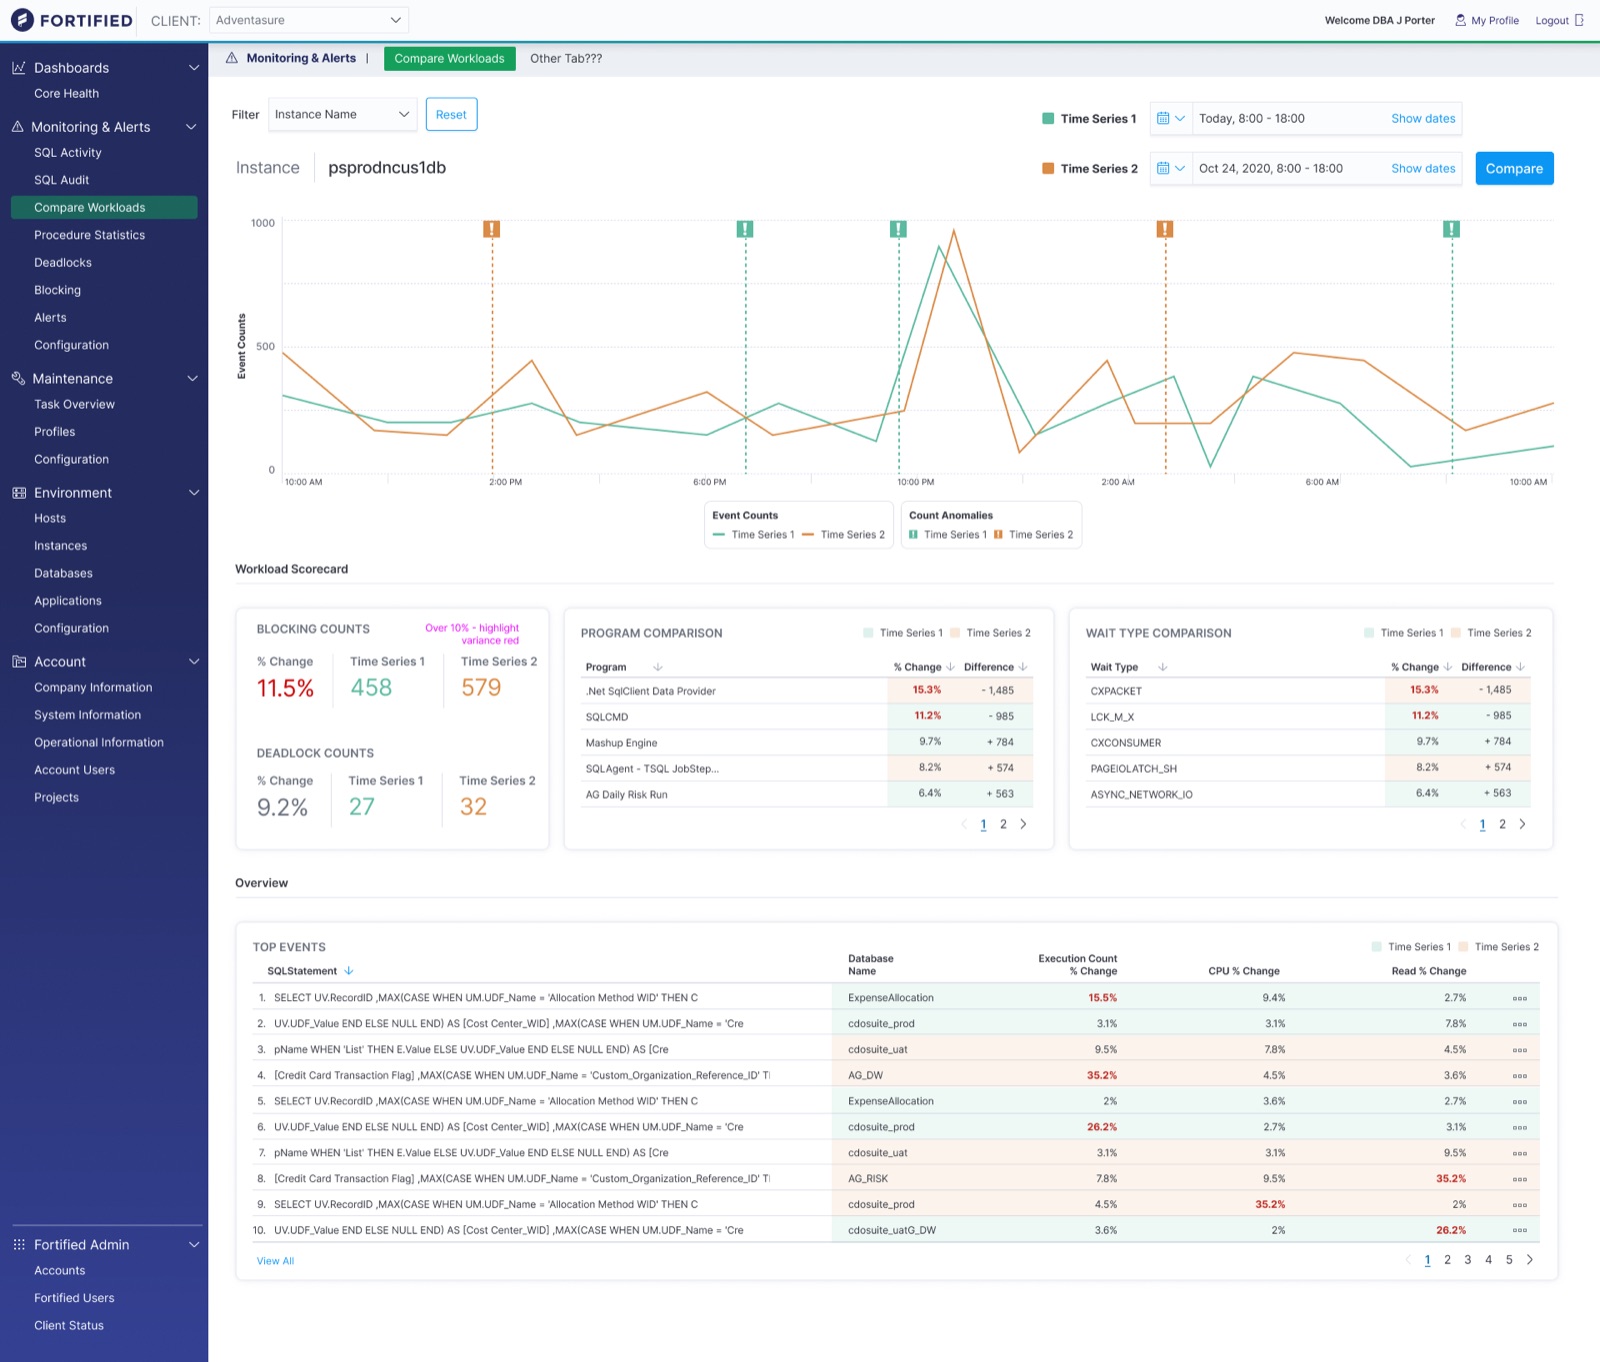
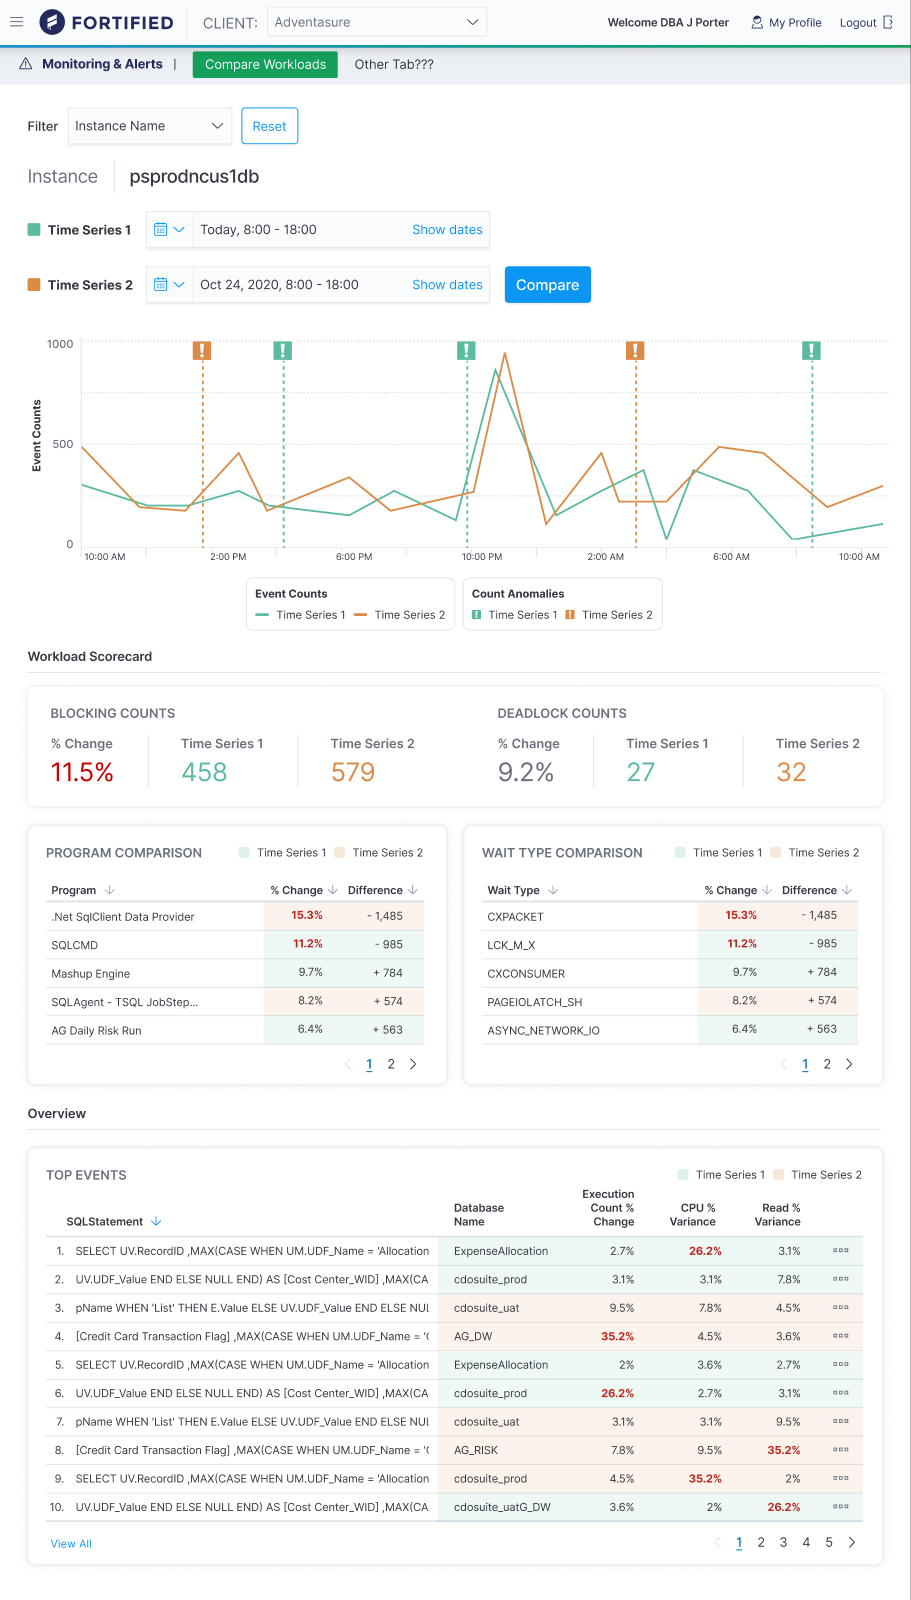
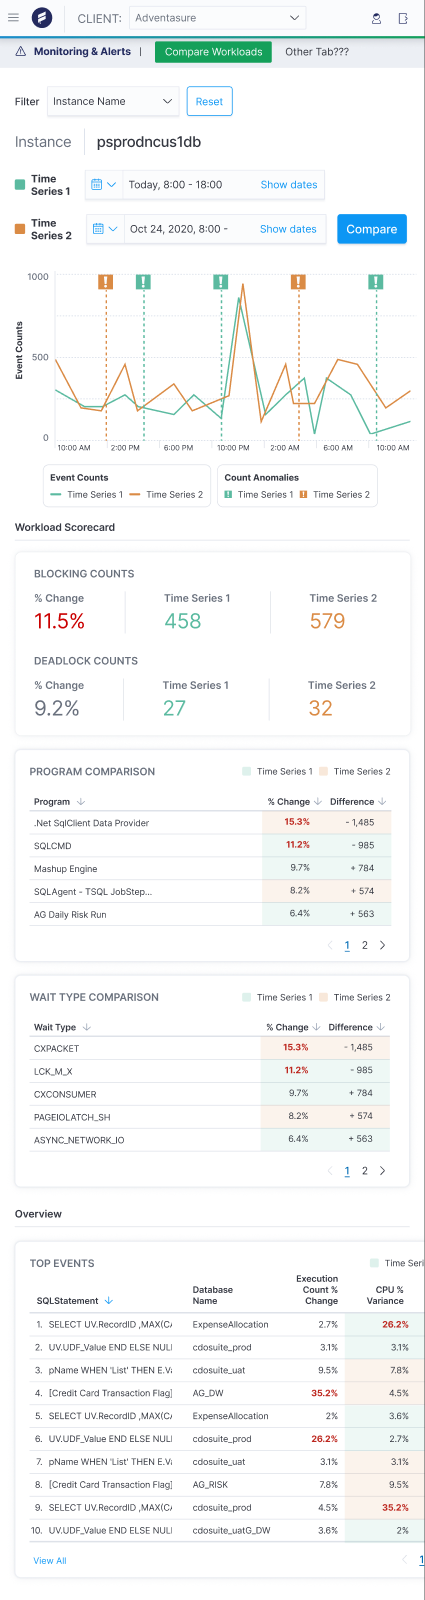
One screen, comparing workloads, at three of its five breakpoints.
05Results
See what needs attention, everywhere at once
System admins more readily see what needs to be addressed across entire data environments. Distinctive visuals help sort data, and size and hierarchy help patterns and alerts be understood more readily.
06Reflection
Hierarchy is the insight.
When everything on a screen is data, the design decision is what to make big. Getting the structure right first, and the brand and the charts second, meant the product could absorb a rebrand and keep growing without losing the thread.
The brief was thin and the direction was open. The CEO’s feedback was that I got it with very little input, and that’s the part of this work I’m proudest of: turning ambiguity into a clear vision an engineering team could build.
Make the important things obvious.