Selected work / Product UX
Panasonic + Ford Dashboard
Watching the viewer while they watch: analytics, identity and video in one dashboard.
- Client
- Panasonic and Ford
- Year
- 2016
- Where
- Agency Work
- Role
- UX and UI design
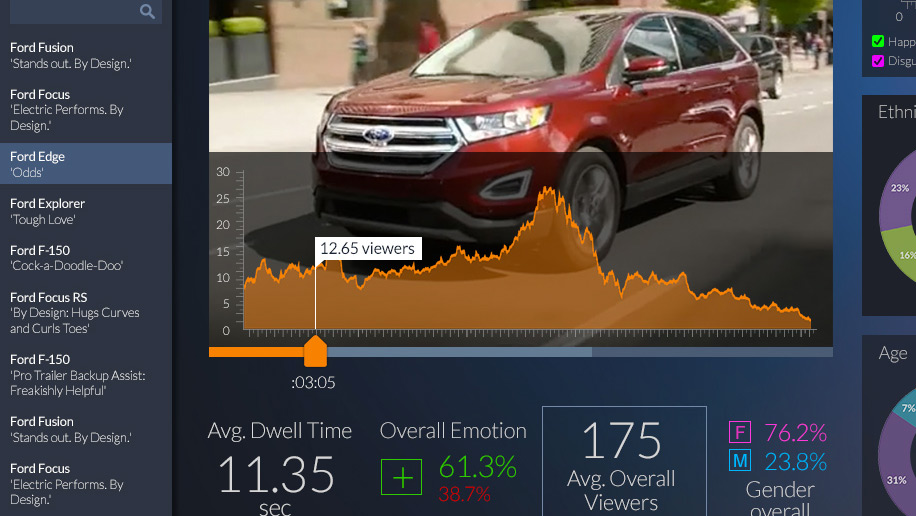
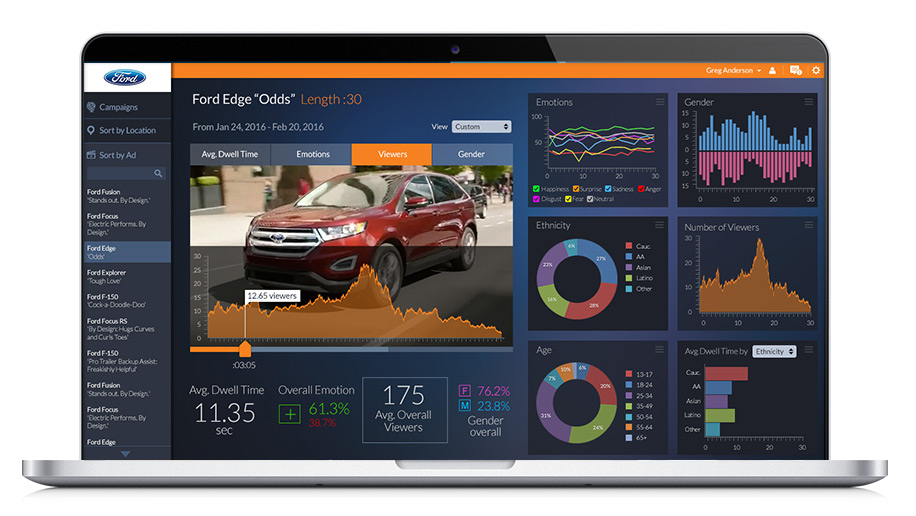
What if we could watch the viewer, while they watch our content? Panasonic challenged us to marry analytical data, identity technology, and video into a single dashboard to provide amazing insight. It’s like getting a bunch of focus group studies without hiring the focus group consultancy and the randoms they then hire off the street.
Data over time
The real opportunity with data and any dashboard display of analytics is the chance to OVERLAY data sets to find patterns and thereby make informed decisions.
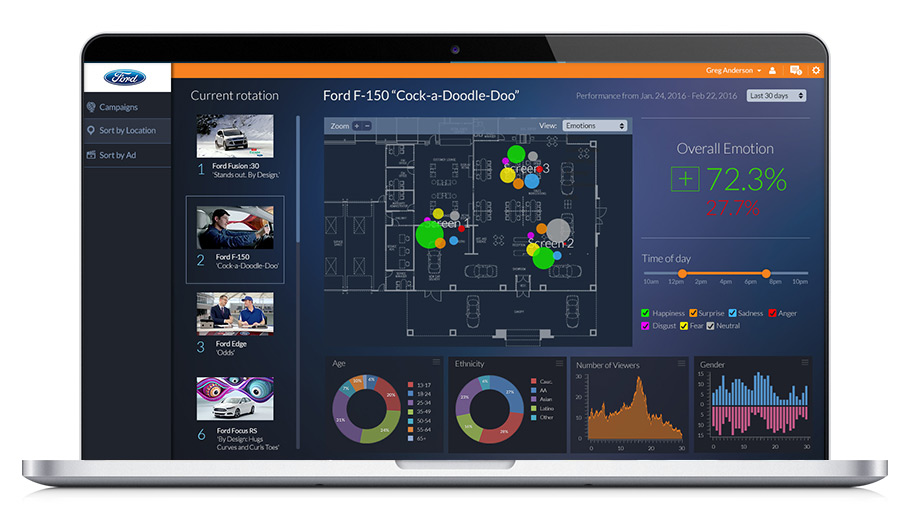
Tracking view density
Using location mapping data, I proposed density overlays to identify traffic and viewer flow. We could see what people are watching what screen, at what times during the video throughout the day.
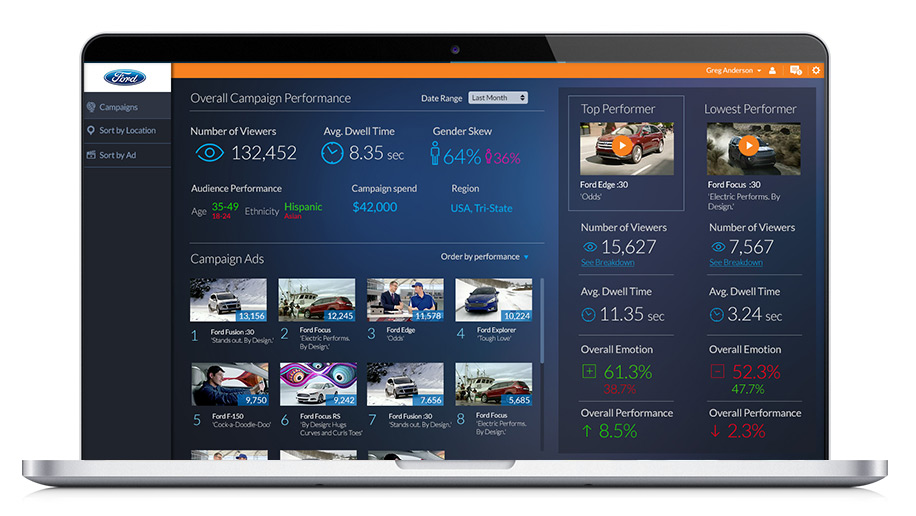
Quickly respond to the market
I've worked on lots of big DRTV projects in the last few years. TV is mostly impenetrable in providing user/viewer feedback. With this immediate and historical data from this technology and at-a-glance dashboard, agencies providing video content can make smart decisions on the fly. Tweaking the story, changing the imagery—positively changing the bottom line. And informing future ideas and content. The dashboard reveals where content succeeds and fails, either validating assumptions or revealing gaps in customer understanding.